Vrindha_Store_Analysis_using_MSExcel
Vindra Store Annual Report 2022
Description:
This project analyzes the sales data of Vindra Store using MS Excel Pivot Tables. The data is sourced from the store’s sales records and includes information about the products sold, sales amounts, and dates of sales. The project is aimed at providing insights into the store’s sales performance and identifying areas for improvement.
Tools and Techniques:
The project utilizes various MS Excel tools and techniques to analyze the data. These include Pivot Tables, Pivot Charts, Pie Charts, Combo Charts, Bar Charts, and Column Charts. The Pivot Tables are used to summarize and aggregate the sales data by different categories, such as product types, sales dates, and sales amounts. The Pivot Charts are used to visualize the summarized data in a graphical format.
The Pie Charts are used to show the percentage breakdown of sales by product types, while the Combo Charts are used to compare the sales performance of different product types over time. The Bar Charts and Column Charts are used to compare the sales performance of different products and product types in a single period or over a longer period.
Results:
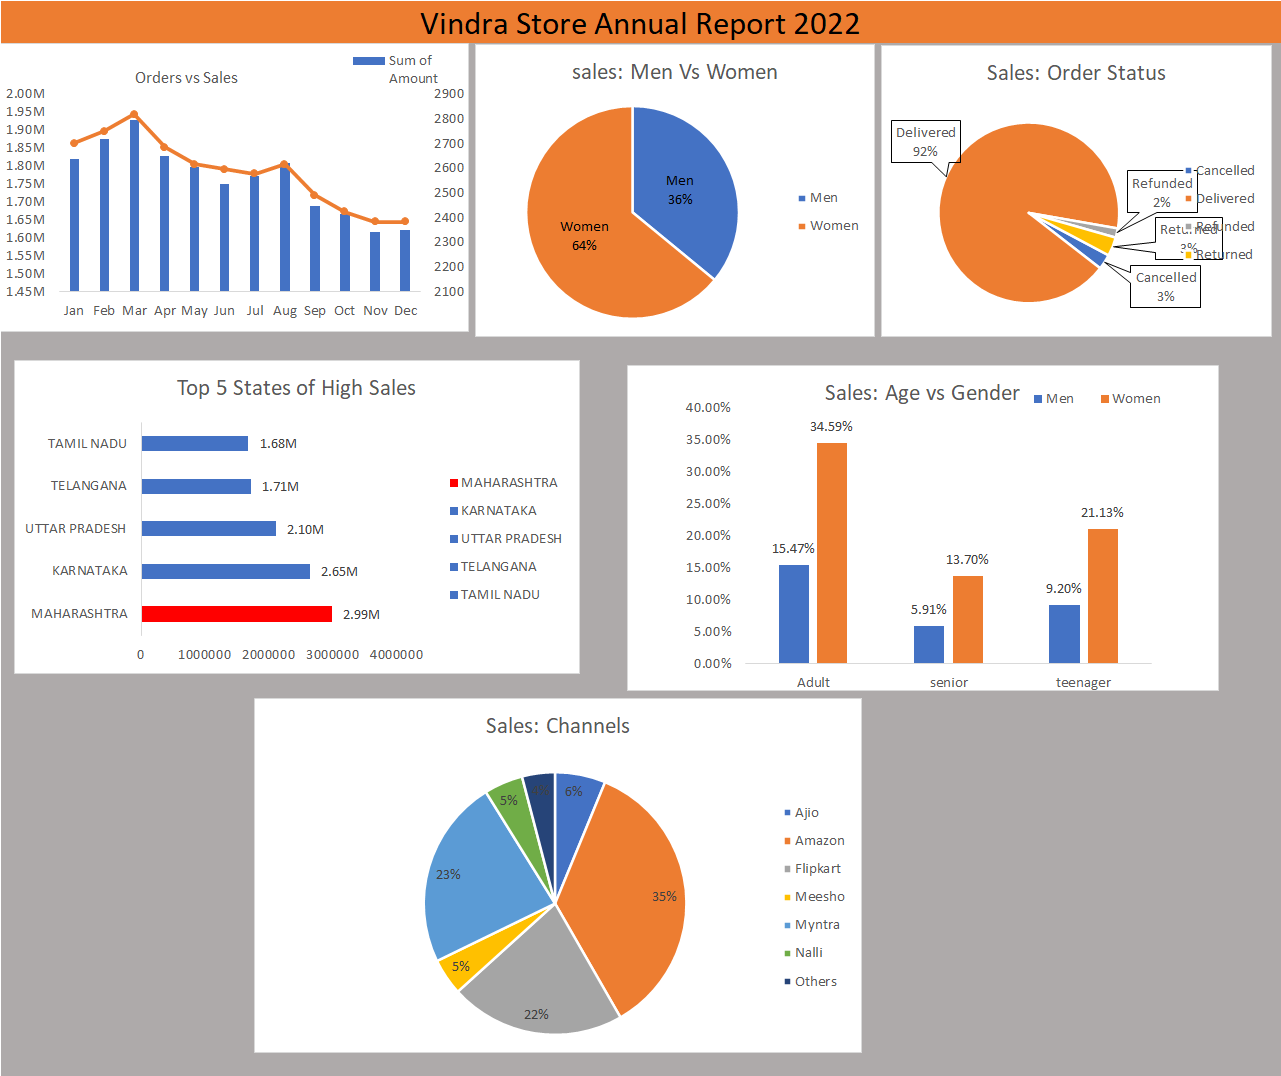
The analysis of the Vindra Store sales data reveals the following insights:
1.The top-selling channels are Amazon,Flipkart,Myntra. 2.Sales tend to be higher during the holiday season, particularly in March,February. 3.Women buy 64% of products and men 34%. 4.out of 100% the order status was delivery rate-92% cancelled rate-3% returned-3% refunded-2% 5.Highest sales occured in maharastra and Telangana 6.More than 60% buyers are Adults
Conclusion:
The Vindra Store Analysis project provides valuable insights into the store’s sales performance, which can be used to identify areas for improvement and increase profitability. The use of MS Excel Pivot Tables and Charts makes it easy to visualize and understand the sales data, which can be shared with stakeholders to inform business decisions.